| Category |
Assignment |
Subject |
Finance |
| University |
University of Exeter |
Module Title |
BEAM046 Financial Modelling |
Individual Assignment
You are part of a consulting firm recently hired by the University of Exeter (UE) to provide investment recommendations for its bond and crypto portfolios. Your manager has identified several key questions that require further research. Throughout your analysis, assume a risk-free rate of zero when calculating excess returns. Additionally, assume no transaction costs or exchange rate fluctuations.
Part 1: Bond Portfolio
UE currently holds the following four AAA-rated corporate bonds, each with equal weighting:
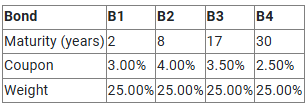
As central banks begin to lower interest rates, UE seeks to understand the potential impact on its bond portfolio. Your team has collected recent bond market data, provided in the “Bonds” worksheet of the data file. This dataset includes key features and price information for 27 AAA-rated corporate bonds. Bond prices are quoted as percentages of face value.
1. Use the bond data to construct and plot the yield curve. Report the yield spread between 10-year and 1-year bonds (i.e., the difference between the 10-year and 1-year yield).
2. Choose an appropriate model to fit the yield curve constructed in Question 1. That is, determine the functional form f(t) in the following equation:

, where t is the time to maturity in years, yt is the log yield, and �~�(0, ��2) is the error term. Specify the model and report the optimal model parameters.
3. Justify your model choice in Question 2. (Hint: You will use this model to estimate the yield for B4, a 30-year bond, despite no bond in your dataset having such a long maturity.)
4. Your team believes the market underestimates the likelihood of another rate cut, with a 75% probability that it has not been priced in. Specifically, you team believes that the log yield should be modelled as:
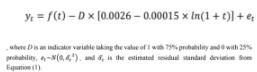
, where D is an indicator variable taking the value of 1 with 75% probability and 0 with 25% probability, ��~�0, �̂�2 , and �̂� is the estimated residual standard deviation from Equation (1).
Use Equation (2) to simulate 1,000 yield paths for maturities ranging from 1 to 30 years. Use the simulated yields to construct and plot the new yield curve that incorporates the rate cut assumption. Report the updated yield spread between 10-year and 1-year bonds.
5. For each simulated yield path from Question 4, calculate the new bond prices and the corresponding rates of returns (relative to the current prices) for B1 ~ B4. How does your rate cut assumption affects the value of UE’s bond portfolio? Report the expected portfolio rate of return.
6. (Optional) Use the simulated returns for B1 ~ B4 from Question 5 to construct the optimal bond portfolio and report the weights. (Hint: Use the 1,000 simulate returns for each bond to estimate expected returns and the covariance matrix.)
Part 2: Crypto Portfolio
UE’s CFO seeks insights into Bitcoin (BTC) and Ether (ETH) time series properties for potential quantitative trading strategies. The historical BTC and ETH daily prices (in USD) are provided in the “Cryptos” worksheet of the data file.
7. Generate autocorrelation function (ACF) and partial autocorrelation function (PACF) plots for BTC daily returns from 2018 to 2022. Interpret these plots and discuss their implications for selecting an appropriate time series model.
8. Choose the most suitable ARIMA( p, I, q) model for BTC daily returns from 2018 to 2022, with values for p and q ranging between 1 and 3. Clearly state your model selection criteria and the optimal values for p, I, and q.
9. UE is considering the following momentum trading strategy for BTC:

Otherwise: do not trade

Here, � � is the one-step ahead forecast of BTC daily return from an AR(2) model with constant term. The AR(2) model is estimated using the ordinary least square (OLS) method and the most recent 60 observations. �̅is the average daily return calculated using the most recent 360 observations
Calculate daily returns generated by this momentum strategy from 2019 to 2024. Aggregate them into monthly returns and report key summary statistics for monthly returns by calendar year.
10. UE is also considering using BTC and ETH to construct a statistical arbitrage algorithm. Assess whether BTC and ETH are suitable trading pairs for this purpose. Provide quantitative evidence to support your conclusion.
11. Following Question 10, define Spreadt = BTCt – ETHt , where BTCt and ETHt are prices of BTC and ETH on day t, and is a hedge coefficient. Use daily prices from 2018 to 2022 to estimate .
12. UE’s statistical arbitrage strategy is:
Buy x units of BTC and short x units of ETH when zt < -1
Short x units of BTC and buy x units of ETH when zt > 1
, where zt is the z-score of spread defined in Question 11. For simplicity, UE keeps the hedge coefficient constant over time. Calculate daily returns generated by this statistical arbitrage strategy from 2019 to 2024. Aggregate them into monthly returns and report key summary statistics for monthly returns by calendar year.
13. According to the summary statistics in Questions 9 and 12, can a superior strategy be identified? If so, state your reasons. If not, discuss the advantages and disadvantages for each strategy.
14. Do any of your previous results suggest that this statistical arbitrage strategy may fall apart?
15. UE aims to integrate the momentum and statistical arbitrage strategies into its high-risk portfolio, treating each strategy as an individual asset. UE’s current high-risk portfolio, P0, consists of six ETFs: VGK, VOO, USO, GLD, IYR, and GBTC. UE uses the monthly returns from 2019 to 2022 to construct P0. The historical monthly returns for these ETFs are available in the “ETFs” worksheet of the data file.
Using the monthly returns from 2019 to 2022, construct a new optimal high-risk portfolio (P1) that includes the six ETFs and the two trading strategies. Report the asset weights of P0 and P1, then evaluate their performances using monthly returns from 2023 and 2024. Discuss your findings and provide investment recommendations on whether UE should incorporate these strategies into its high-risk portfolio.
16. (Optional) Compare the weights of P0 and P1. Do they make economic sense? (Hint: Discuss why certain assets receive higher or lower allocations after incorporating new risky assets. If any assets receive negative weights, explain the reasoning behind the short positions.)
17. (Optional) How can UE improve its momentum or statistical arbitrage strategy? Propose and implement these improvements. Provide justifications and quantitative evidence to demonstrate why your approach is more suitable.
 Get Expert-crafted assignments


