| Category | Assignment | Subject | Sociology |
|---|---|---|---|
| University | BPP Business School | Module Title | BA40101E Analysis of Real-World Issues |
| Assessment Type | Case Study |
|---|---|
| Assessment Title | Assessment 2 |
| Academic Year | Semester 2, 2025-26 |
Firms that are quoted on the stock market can raise money by issuing shares. These are sold on the ‘primary stock market’. People who own the shares receive a ‘dividend’ on them, normally paid six-monthly. The amount varies with the profitability of the company.
People or institutions that buy these shares, however, may not wish to hold on to them forever. This is where the ‘secondary stock market’ comes in. It is where existing shares are bought and sold. There are stock markets, primary and secondary, in all the major countries of the world.
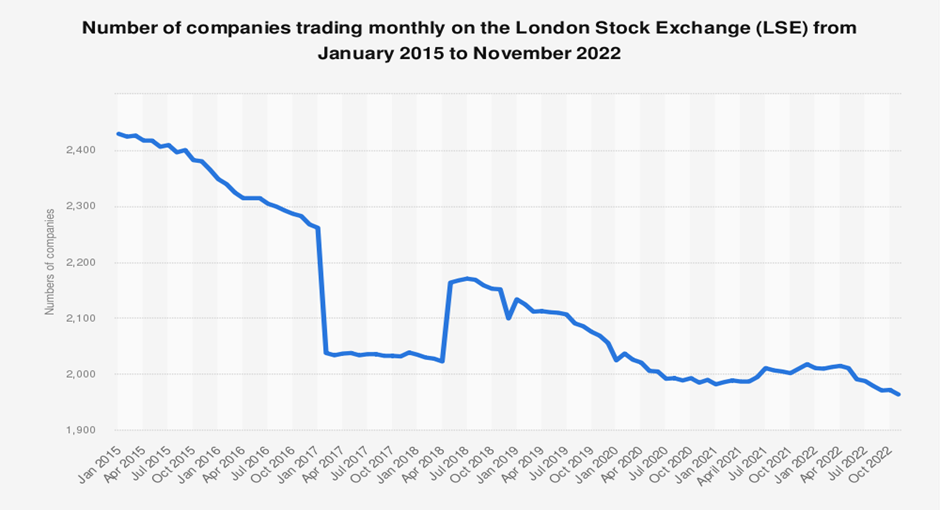
Figure 1: The Outlook of trading companies on the London Stock Exchange

Source: The London Stock Exchange, 2022
There are 1977 companies (as of December 2020) whose shares and other securities are listed on the London Stock Exchange, and trading in them takes place each weekday. The prices of shares depend on demand and supply. For example, if the demand for Tesco shares at any one time exceeds the supply on offer, the price will rise until demand and supply are equal. Share prices fluctuate throughout the trading day, and sometimes price changes can be substantial.
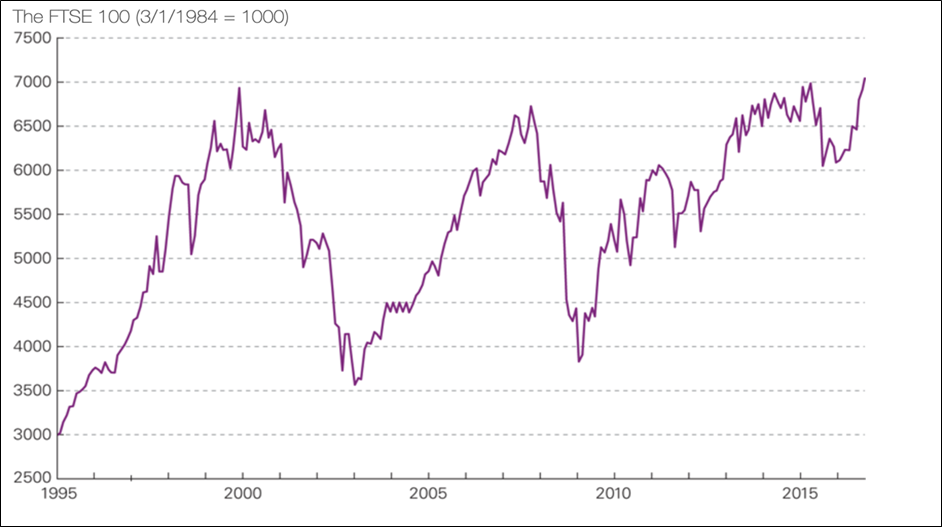
To give an overall impression of share price movements, stock exchanges publish share price indices. The best known one in the UK is the FTSE 100, which stands for the ‘Financial Times Stock Exchange’ index of the 100 largest companies’ shares. The index represents the average price of these 100 shares. The chart shows movements in the FTSE 100 from 1995 to 2016. The index was first calculated on 3 January 1984 with a base level of 1000 points. It reached a peak of 6930 points on 30 December 1999 and fell to 3287 on 12 March 2003, before rising again to a high of 6730 on 12 October 2007.

Figure 2: Outlook of FTSE between 1995-2015

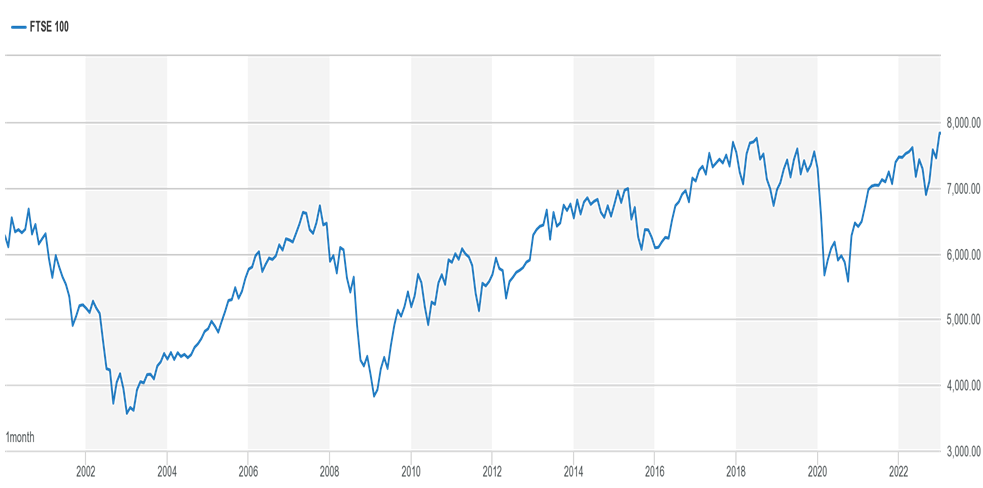
Figure 3: Outlook of FTSE between 2002- 2022
However, with the financial crisis, the index fell to a low of 3512 on 3 March 2009. During the latter part of 2009 and 2010, the index began to recover, briefly passing the 6000 mark at the end of 2010, but fluctuating around 5500 during 2011/12. The index was on an upward trend from 2013, peaking at 7104 on 27 April 2015, but then the index fell back to around 6000 in early 2016. But then, after the initial shock of the Brexit vote in June 2016, it rose again to above 7000 in October 2016. The fluctuation also continues with an upward trend from 2010, with a sharp decline in 2020.
1. What causes share prices to change?
2. On the London Stock Exchange, why were prices so high in 1999, but only just over half that value just three years later?
3. Why did this trend occur again in the late 2000s and until 2022- (Hint: Brexit and Covid-19 impact).
General Hint: the answer relies on the demand and supply factors across these times.
Get the Solution of this BA40101E Assessment
Order Non-Plagiarised AssignmentHaving trouble completing your BA40101E Analysis of Real-World Issues assignment on time? Our Sociology Assignment Help service is the best for you! Our expert writers offer high-quality, plagiarism-free, and AI-free assignments at pocket-friendly rates. You can even check our free assignment samples before placing your order. We promise on-time delivery and 24/7 support, no matter your academic needs. From Business Management to technical subjects, we cover it all. We also provide BPP Business School Assignment Samples that the phd expert writers have written. Contact us now!
Hire Assignment Helper Today!
Let's Book Your Work with Our Expert and Get High-Quality Content
