| Word Count | 1000 wORDS |
|---|---|
| Assessment Title | Presentation – Second Summative Lab Report |
| Academic Year | 2024-25 |
| Semester: | 6 |
Use the conference paper template in the Lab Practicals folder on Minerva for your second summative report (i.e., the conference-style report). Use 11 pt for the section headings and 9pt font (Times New Roman) for the main text.
You do not need the standard cover page for the report; replace the headnote with your details (name, student ID, title of the practical).
You are required to submit the report as an electronic version to the appropriate VLE Turnitin submission to allow for plagiarism checking, verification and archiving of the submissions.
This will be written in the form of a technical paper to be presented at an international conference. A template and an example paper are provided in the Lab Practicals folder of the VLE and there is a limit of 6 pages (excluding the cover page). Obviously, this requires very concise phrasing, selectivity of results and associated discussion, but remember that this is a common format used in peer-reviewed journals.
Follow the format (font size and type) of the template and maintain the two columns format. Below is the format of the Conference-style Report. Note that this report does not require a table of content.
Conference-style report format (Max 6 pages):
1.Abstract – Max 200 words comprising of the purpose of the practical, the methodology, the key findings and the overall conclusion.
2.Introduction – present what you set out to do, mentioning the intended scope of investigation and any special features, together with its industrial relevance or applications and a brief relevant background theory/science.
3.Methodology – provide a summary of what you actually did using the third person passive voice, not the procedure given in the manual. Note that an experimental diagram is not needed in the Methodology.
4.Results – provide an account of data obtained, usually in the form of tables and/or graphs (again, numbered and captioned). Include sample calculations where appropriate, but not every single one. Do not include the raw Excel data (results) in tables. Present only the calculated results in a table(s).
5.Discussion – this main section of the report should be used to assess the significance of your findings, by critically appraising your results. That is, comprehensively discuss the results explaining “WHY” the trend of results was obtain. Support arguments with theoretical concepts and references. Any shortcomings and errors should also be noted.
6.Conclusions - Max 250 word stating what was done, the essential findings of your work and the relevance of the findings, which can be in the form of an introductory paragraph followed by bullet points if appropriate.
7.References – list all the references you have cited in the text. A minimum of five references (from reliable sources such as textbooks, journal papers, etc.) are required to support the introduction and discussion. Note: It is best to use the Harvard referencing method.
The report is worth 100 marks and the marking scheme is as follows:
Background information is included in the textbook below.
Dunn W. C., Fundamentals of industrial instrumentation and process control,
Chapter 11.1-11.3, 2018
Library reference number: 9781260122268
The objective of this practical is to determine the best controller type for controlling an air heating system. You will study the difference between ON/OFF (two-step control) and continuous control (i.e., proportional-only, proportional-integral and proportionalintegral-derivative control) and understand how these two controllers can be used to stabilise the system when a disturbance impacts its continuous operation.
Process control is ubiquitous in chemical engineering, and the concept of control is fundamental to maintain steady-state operation of a process to produce quality products efficiently and economically. Process variables that are most commonly measured and controlled include temperature, pressure, flowrate, liquid level and composition. Control can either be: i) feedback – the process variable to be controlled is measured and compared with its desired value (set-point value, SP); ii) feed-forward – process input variables are measured and used to provide appropriate control action; and iii) cascade control – using controllers in series where the first control element in the system measures a process variable and alters the set-point of the next control loop.
This practical is designed to demonstrate the performance of a feedback controller.
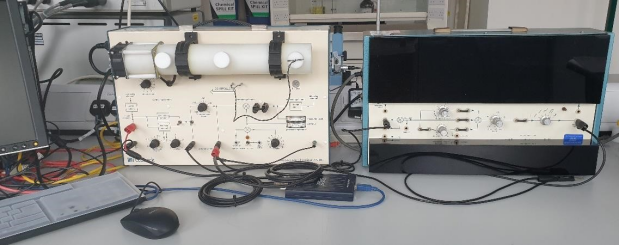
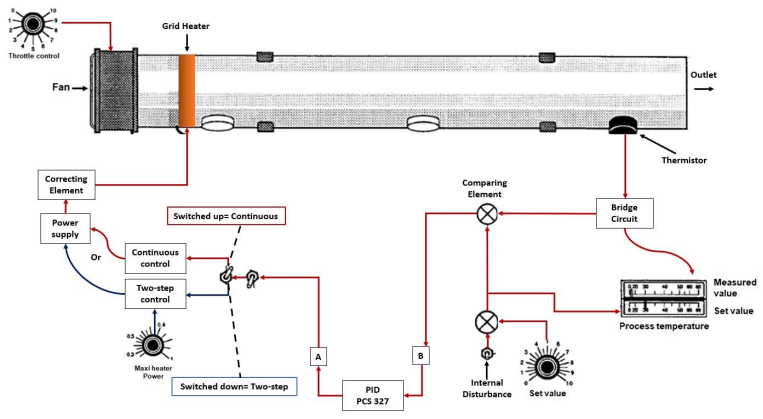
The PT 326 Feedback Process Trainer and PCS 327 Process Controller are combined to produce a self-contained heating process simulation with built-in controller functions. The process is that of an electrical air heater with heating current as the input variable and air temperature as the controlled variable, see Figure 2.
Are You Looking for Answer of CAPE2030 Report Assignment
Order Non Plagiarized AssignmentOn-off control is one of the most common forms of closed loop control and simply involves power to the electrical heater being switched on when the measured temperature falls below the set value and switched off when it rises above. That is, when the error is positive (error > 0), the controller is switched ON and when the error is zero or negative (error ≤ 0), the controller output is set to OFF. In on-off control, there is an overlap as the error increases above zero or decreases below zero. This creates lower and upper limits of the error known as the dead band, between which there is no change in the controller output. When there is an overlap, the controller output signal causes the power to the heater to alternate between maximum and minimum levels as the controlled condition falls below a lower limit or rises above an upper limit.
In proportional control, the output from the controller (i.e., the power supplied to the heater) is adjusted proportional to the error signal, with the output correction continuously applied to the controlled variable. This is achieved by relating the controller output, V, to the error or deviation, E, as follows:
V = KpE + M (1)
where
M is the constant power input at the SP value i.e. zero error
E is the error (deviation) between the SP and measured values Kp is the proportional gain
The proportional band is the band of controller output over which the control element (in this case heater power) can be adjusted. It is given by:
100
Proportional Band = (2)
Proportial gain (KP)
Thus, a small proportional band represents a high gain, and hence only a small error is required to produce a large change in the controller output. To reduce the error to zero, the gain must be increased, but if increased too high (% proportional band is low) the system oscillates and the system becomes unstable. Therefore, there is a compromise between the offset and the fluctuations (i.e., minimise or eliminate the offset and reduce the time taken to reach the SP).
Any sustained deviation (dependent on the % proportional band) between the measured and SP values is referred to as the "offset".
Proportional-Integral (PI) Control
For integral action, the controller output not only accounts for the error but also the time for which the deviation has persisted. The response is proportional to both the magnitude of the error and the duration of the error, with the integral term being described by:
V = −Ki ∫ Edt (3)
or
dV
dt = −Ki × E (4)
where Ki is the integral gain.
Through integral control the offset by proportional control can be eliminated. However, since the control is dependent on the accumulated errors with time, the measured value can easily overshoot the SP value.
With derivative action, the controller output is proportional to the rate of change of the error with time according to:
dE
V = Kd ( ) (5)
dt where Kd is the derivative gain.
Air is drawn into the tube by a small fan and is driven past an electrical heater. The heated air exits the end of the tube where the temperature is measured by a thermistor. In feedback control the air temperature is measured and compared to the set point (SP) value, with the controller then adjusted (via the feedback loop) to move the measured value (controlled variable) closer to the SP. NB, the output from the thermistor is given in volts (V), but is converted to °C using the instrument calibration. Temperature can then be read from the temperature indicator on the PT326. A typical example of the data output is shown in Figure 1. The blue line is the power input to the heater and the orange line is the measured response in V (equivalent to the change in temperature).
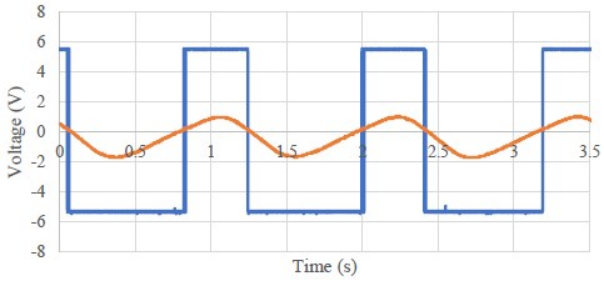
Figure 1. A diagram of a typical ON/OFF response of the process.
The experimental set-up is shown in Figure 2 and a schematic of the feedback loop is shown in Figure 3.
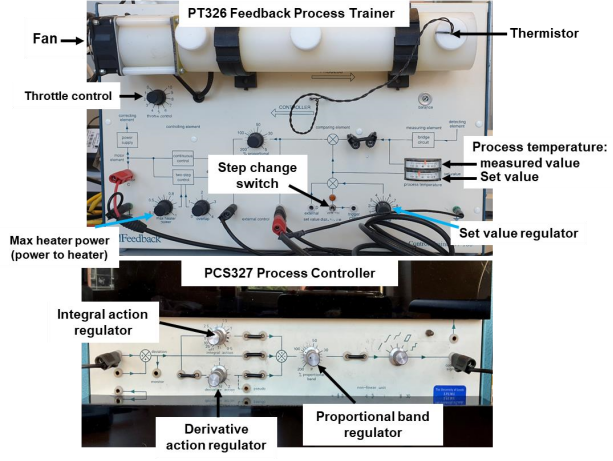
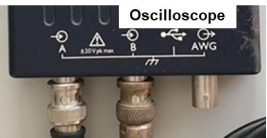
Figure 2. Industrial process control experimental set-up (PC connection not shown)
To clearly understand the working principle behind a PID temperature controller, you should look at Figure 4 carefully.
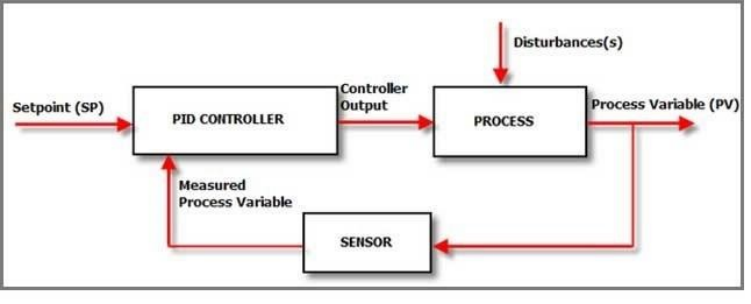
Figure 4. A schematic of response signal processing
The set point (SP) is the desired value that the entire process has to produce. Assume that the temperature control system in your process has a set point of 35°C;
The whole process is desired to create a steady temperature close to 35°C. Now, the PID temperature controller comes in and it factors in the set point and then compares it with the real (measured) value of the Process Variable (PV). A PID controller then looks at the measured value and sees how far or close it is to 35°C.
If the SP and the process variable (PV) are equal, then your controller does not have to do anything. But if there is a disparity between the two values, it means that there is an error that requires correction.
In the process, the correction could be cooling or heating. The corrective action depends on whether the PV value is higher or lower than the SP value. If the temperature is low, the sensor will pick up the lower temperature and feed it to the controller. The controller then sees the “error in temperature” and aims to correct it to the desired range. If a disturbance (increase/decrease of temperature) hits the system again, the process repeats.
Achieve Higher Grades CAPE2030 Assignment
Order Non Plagiarized AssignmentThe thermistor is part of a bridge circuit that produces an electrical signal, which is sent to a comparing element. The size of the signal is reflected on the measured value meter on PT 326. Then, the second SP value signal is also sent to the comparing element, in which its value is displayed on the set value meter on PT 326.
The difference between the two signals, also known as an error signal, is passed to the external control port B, as illustrated in Figure 5. The output of port B is sent by a wire to the PCS 327. On the PCS 327 equipment, the error signal can be altered by the proportional band, integral action and derivative action controls.
The altered signal passes through the selector switch and then to the control signal port. The signal is sent to port A by a wire. The error signal passes through a switch, which is in the down position. The signal continues to a second switch, which is used to select on/off control (switched down) or continuous control (switched up). The electrical signal is passed to a power supply, which supplies power to the correcting element (heater).
An oscilloscope with 2 channels is used to monitor the temperature difference between the set and measured values.
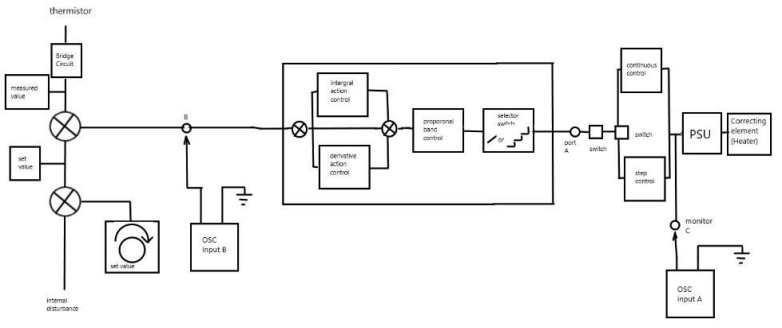
Figure 5. A block diagram of PT326 and PCS 327
Experiment 1: Two Step (On-Off) Control
This is one of the most common forms of closed loop feedback control and simply involves the electrical power being switched on when the measured temperature falls below the set value and switched off when it rises above it.
The shape of the deviation curve may be altered by decreasing the rate of heat input or by changing the time delays in the system. The rate of heat input can be altered by varying the heater power knob and so varying the maximum electrical power.
Switch on the PCS327 and PT326
Adjust the SP using the set value regulator to 35 ˚C. Set overlap to 0.
Click the start button to record the signal traces of power (V) and temperature (V) as the system responds to the controller. The data output is read using the Picoscope software on the lab computer.
Click the pause button to stop once multiple (at least 5) oscillations have been observed.
Save the collected data in the appropriate folder.
Repeat the procedure for the throttle control level from 3 to 9.
Using the same setup as above, set the throttle control to 5. Set the max heater power to 0.3.
Click the start button to record the signal traces of power (V) and temperature (V) as the system responds to the controller. The data output is read using the Picoscope software on the lab computer.
Click the pause button to stop once multiple (at least 5) oscillations have been observed.
Save the collected data in the appropriate folder.
Repeat the procedure but vary the max heater power as follows: 0.5, 0.7, 0.9 and 1.
Using the same setup as above, set the throttle control to 5. Set the max heater power to 1.
Set the SP at 10 ˚C using the set value dial.
Click the start button to monitor the signal traces of power (V) and temperature (V) as the system responds to the controller.
Observe the behaviour of the two-step controller and record whether the controller action is on/off OR continuous in the table below.
Repeat the procedure using the following SP values: 20, 30, 40, 50 and 60 °C.
* Saving csv and JPEG files is not required for section 3.
Observation
|
Sample No. |
Temperature (˚C) |
ON/OFF Behaviour |
|
1 |
10 |
Y/N |
|
2 |
20 |
Y/N |
|
3 |
30 |
Y/N |
|
4 |
40 |
Y/N |
|
5 |
50 |
Y/N |
|
6 |
60 |
Y/N |
Guidance for Results and Discussion for Experiment 1
1.By changing the air flow rate and the heater power, discuss your observations regarding the temperature deviations (amplitude) and the frequency of on-off control. Comment on why the trend in behaviour is as observed.
2.Comment on the response of the controller when the heater power is fixed at 1
and the throttle control fixed at 5, but the SP value is adjusted from below to above room temperature.
Experiment 2A: Proportional (or P-Only) Control
Part 1: Changing the % proportional bandwidth
Set the switches and dials to the correct positions for the P-only controller as demonstrated in the lab video.
Set Power to 1 and Throttle to 5.
Check that the integral action is OFF and derivative action is ZERO.
Start recording and begin to gradually reduce the % proportional bandwidth from 100 to 40 % – data collection should be approximately taken for 0.5 min.
Observe the changes in the thermistor voltage output (magnitude and oscillations) as the proportional bandwidth is reduced.
Save the collected data in an appropriate folder.
Repeat the procedure by increasing the proportional bandwidth from 100 to 200%. Make the same observations as discussed above.
Part 2: Introducing a disturbance (step change)
The internal disturbance switch is used to induce a disturbance to the SP value. Introduction of a step change provides a means of assessing how the system response to a disturbance. When the disturbance is introduced, a rapid increase in the blower throttle control will cause a change in measured value and deviation.
Procedure
Maintaining the setup in Experiment 2 Part 1, set % PB to 40.
Start recording the thermistor output measured in V.
With the initial data observed, introduce a disturbance by changing the position of the
‘Internal Disturbance’ switch upwards.
Stop the data collection once the trace (V) reaches a steady state value.
Read and record the temperatures of the SP and PV values from the temperature indicator.
Save the collected data in an appropriate folder.
Repeat the procedure above using different % proportional bandwidths (select 5 values between 40 and 160%).
|
% PB |
SP Before Disturbance |
SP After Disturbance |
PV After Disturbance |
|
˚C |
˚C |
˚C |
|
|
40 |
35 |
43 |
39 |
|
70 |
35 |
43 |
37 |
|
100 |
35 |
43 |
36 |
|
140 |
35 |
43 |
35 |
|
160 |
35 |
43 |
34 |
Experiment 2B: Proportional-Integral (PI) Control
In this set of experiments, you will be choosing the best (minimum offset) % proportional bandwidth observed from Experiment 2A and study the influence of the integral action on the response of the system. An elimination of offset will be observed as a result of the application of integral controller action.
Use the settings of the best experiment from Experiment 2A Part 1.
Introduce a new integral action value (start with 0.5).
Start recording the thermistor output measured in V.
With the initial data observed, introduce a disturbance by changing the position of the
‘Internal Disturbance’ switch upwards.
Stop the data collection once the trace (V) reaches a steady state value.
Read and record the temperatures of the SP and PV values from the temperature indicator.
Save the collected data in an appropriate folder.
Repeat the procedure above using different integral action values between 0.5 and
5.0.
PB AT 40 value for Exp 2B
Buy Answer of CAPE2030 Assignment& Raise Your Grades
Order Non Plagiarized AssignmentExperiment 2C: Proportional-Integral-Derivative (PID) Control
|
I |
SP Before Disturbance |
SP After Disturbance |
PV After Disturbance |
|
|
˚C |
˚C |
˚C |
|
0.5 |
35 |
43 |
45 |
|
1 |
35 |
44 |
45 |
|
1.5 |
35 |
44 |
45 |
|
2.5 |
35 |
43 |
45 |
|
5 |
35 |
43 |
46 |
bandwidth and integral action from Experiment 2B and study the effect of introducing a derivative action.
Procedure
Use the settings of the best experiment from Experiment 2B.
Introduce a new derivative action value (start with 0.1).
I SP Before Disturbance SP After Disturbance PV After Disturbance
˚C ˚C ˚C
0.5 35 43 45
1 35 44 45
1.5 35 44 45
2.5 35 43 45
5 35 43 46
Start recording the thermistor output measured in V.
With the initial data observed, introduce a disturbance by changing the position of the
‘Internal Disturbance’ switch upwards.
Stop the data collection once the trace (V) reaches a steady state value.
Read and record the temperatures of the SP and PV values from the temperature indicator.
Save the collected data in an appropriate folder.
Repeat the procedure above using different derivative action values between 0.1 and
0.6.
|
D |
SP Before Disturbance |
SP After Disturbance |
PV After Disturbance |
|
|
˚C |
˚C |
˚C |
|
0.1 |
35 |
43 |
45 |
|
0.3 |
35 |
44 |
45 |
|
0.4 |
35 |
43 |
45-average taken(due to time) |
|
0.5 |
35 |
43 |
45 ^ |
|
0.6 |
35 |
44 |
45^ |
Experiment 2D: Further Investigation
Choose the worst % proportional bandwidth observed from Experiment 2A and adjust the integral and derivative actions so that the controller obtains an optimum control result (i.e., small offset, minimal instabilities). Demonstrate your choice of integral and derivative values using appropriate plots.
IA- 1.5.
D- 0.3 AND 0.2
PB- 160
MEAURED VALUE 45- SET VALUE 43 (STABLE VALUES)
Kept everything same except the D and got same values.
Guidance for Results and Discussion for Experiment 2:
1.Discuss the difference between the controllers in terms of oscillations/amplitude, response and settling time (how quick or slow the response takes to reach the set point), any instabilities, deviations/offsets.
2.Discuss the influence of the different P-bands on P-control, the different integral actions on PI-control, and the different derivative actions on PID-control.
3.Summarise the results of the P, PI, and PID controllers in a table (s) including deviations, rise time, peak time, settling time, and oscillations.
SUGGESTION: Figure 6 below shows how the PV adjusts following a change in the SP value (step-change deviation).
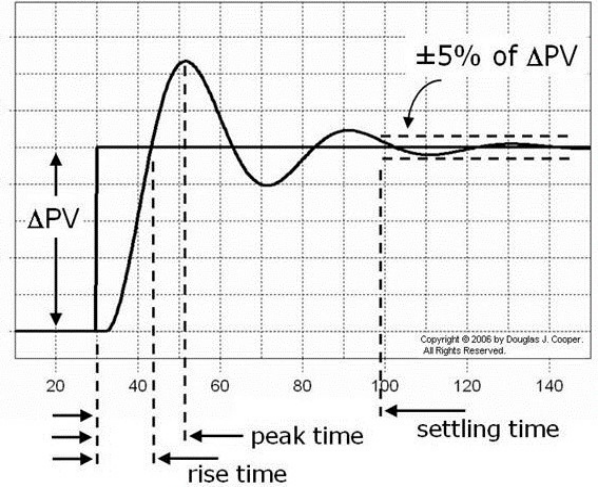
Figure 6. A typical response diagram showing SV and PV vs time
Rise Time = time until the PV first crosses the SP value.
Peak Time = time to the first peak.
Settling Time = time until the deviation between PV and SP is within about 5% of 0 V.
Deviation or steady-state error = SP – PV at steady-state. This can be expressed in % as follows;
Error (%) = SP − PV × 100%
SP
From the plot, we see that the set point is stepped at time t = 1.5 s.
The time related criteria are then obtained by reading off the time axis as follows:
Rise Time = (2.3 – 1.5) = 0.8 s
Peak Time = (2.6 – 1.5) = 1.1 s Settling Time = (5.0 – 1.5) = 3.5 s
Order Custom Answers for your CAPE2030 Report Assignment
Order Non Plagiarized AssignmentAre you stressed about your CAPE2030 Lab Manual Presentation – Second Summative Lab Report? There's no need to worry! We are here to assist and provide zero-AI Assignment Help of high quality with original content written by our PhD expert writers. Just write my assignment, and we will make sure your assignment will be completed on time by our Engineering Assignment Writers. Also, we have free assignment samples for students, so you can get an idea of the quality. Now, stop worrying about late submissions and contact us for the best grades. Hand over your assignment worries to our experts today!
Hire Assignment Helper Today!
Let's Book Your Work with Our Expert and Get High-Quality Content
