| Category | Assignment | Subject | Business |
|---|---|---|---|
| University | Torrens University Australia | Module Title | STA201 Business Statistics |
| Word Count | 1000 Words |
|---|---|
| Assessment Type | Individual |
| Assessment Title | Analytics Assignment |
The Subject Learning Outcomes demonstrated by successful completion of the task below include:
a) Produce, analyse, and present data graphically and numerically, and perform statistical analysis of central tendency and variability.
b) Apply inferential statistics to conclude populations, including confidence levels, hypothesis testing, analysing variance and comparing with benchmarks in decision-making processes.
c) Measure uncertainty, including continuous and discrete probability and sampling distributions, to select appropriate methods of data analysis.
d) Apply parametric tests and analysis techniques to determine causation and forecasting to assist decision making.
e) Utilise technology to analyse and manipulate data and present findings to peers and other stakeholders.
Perform multiple linear regression analysis on a sample dataset and present your findings with the integration of statistical analysis.
Please refer to the Instructions for details on how to complete this task.
Linear regression allows us to develop models in order to predict values of a numerical variable, based on the values of one or more variables. By developing models and being able to estimate values of important variables, regression analysis helps managers and stakeholders make better, more informed decisions.
This assessment will help you to improve your understanding of multiple linear regression by applying it to a real-world problem. Through this assessment, you will also demonstrate and advance your skills when using the Data Analysis ToolPak to conduct the regression analysis.
1. You will use the same dataset you used for Assessment 1. The data includes house sales during period A (the months May 2023, June 2023, July 2023 and August 2023) combined with house sales in period B (September 2023, October 2023, November 2023 and December 2023). You are required to use the following variables for each house sale:
a. Selling price
b. Number of bedrooms
c. Number of bathrooms
d. Property size
e. Distance (in kms) to the nearest train station or bus stop
2. For this assessment, combine the sales of two months into one dataset, meaning you will have one dataset with 50 observations.
3. Consider house price as a dependent variable and number of bedrooms, number of bathrooms, property size and distance to nearest train station as independent variables.
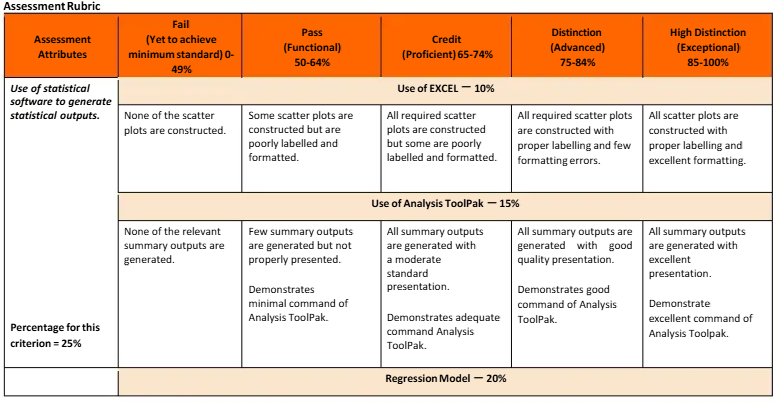
4. Use Analysis ToolPak in EXCEL to generate statistical outputs in tasks where needed.
5. All the tasks must be answered in a Word document and a Report format. Clearly labelled relevant EXCEL outputs must be inserted into the Word document.
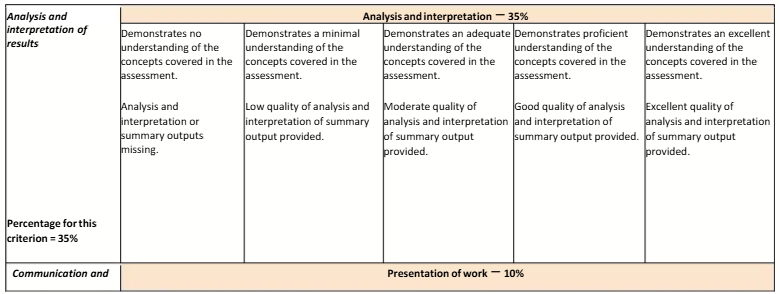
1. Prepare a summary statistics table and discuss the central tendency and variations for all variables.
2. Plot the dependent variable (house price), against each independent variable using the scatter plot function in EXCEL. Comment on the strength and the nature of the relationship between the dependent and the independent variables.
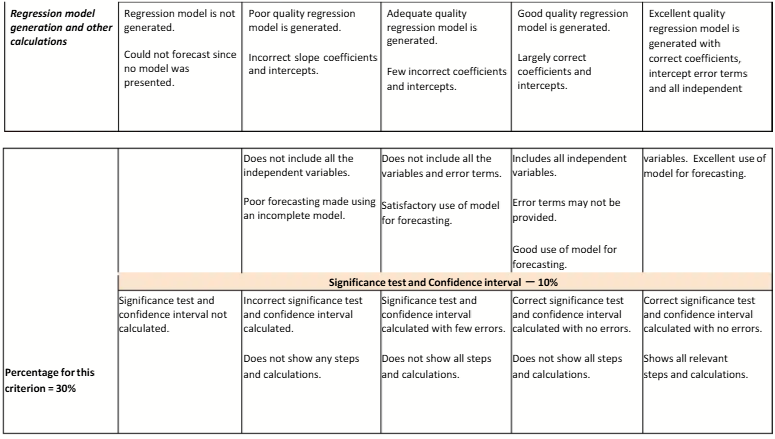
3. Generate a multiple regression summary output. Using the information on the regression output, state the Multiple Regression equation.
4. Interpret the meaning of slope coefficients of independent variables.
5. Interpret the R2 and adjusted R2 of your model.
6. Conduct a test for the significance of your overall multiple regression model at the 5% level of significance. You must state your null and alternative hypotheses.
7. At the 5% level of significance, determine whether each independent variable makes a significant contribution to the Regression model. Based on these results, indicate the independent variables to include in this model.
8. Construct a 95% confidence interval estimate of the population slope of house prices with property size. Interpret your results.
9. Construct a 95% confidence interval estimate of the population slope of house prices with distance to the nearest train station or bus stop. Interpret your results.
10. Choose one of the houses currently advertised for sale in your allocated suburb (use 2024 data). Make sure to choose a house whose asking price is also advertised. Predict the price of the house using the regression equation you generated in Task 3 and the values of the independent variables as advertised. Compare the predicted price with the asking price.
11. You are supposed to prepare a report according to the acceptable report format. It is essential that you clearly and effectively communicate your professional writing skills through the said report format and correct use of presentation and grammar. You must include a cover page, an Executive Summary, a table of contents, an introduction, appropriate headings, and subheadings for the body of the report, a conclusion, and the end a Reference list. Students may want to include an Appendix; however, this is not compulsory. Note that the cover page, executive summary, table of contents and references are not included in the word count.
You must use the appropriate APA 7th Edition style for citing and referencing research. Please see more information on referencing on the Academic Skills webpage.
Submit this task via the Assessment link in the main navigation menu in STA201: Business Statistics.
Please note that during the submission process, you will need to submit both your EXCEL file, which includes your dataset with clearly labelled statistical outputs and the Word document, which addresses all tasks (inclusive of summary output). Once your first item has been uploaded, click 'Browse Your Computer to attach your extra documents as an appendix. Then click the Final Submit button. Ensure that all documents are uploaded before hitting the "Submit" button.
Achieve Higher Grades with STA201 Assignment Solutions
Order Non-Plagiarised AssignmentAll students are responsible for ensuring that all work submitted is their own and is appropriately referenced and academically written according to the Academic Writing Guide. Students also need to have read and be aware of Torrens University Australia's
Academic Integrity Policy and Procedure and subsequent penalties for academic misconduct. These are viewable online.
Students also must keep a copy of all submitted material and any assessment drafts.
To apply for special consideration for a modification to an assessment or exam due to unexpected or extenuating circumstances, please consult the Assessment Policy for Higher Education Coursework and ELICOS, and if applicable to your circumstances, submit a completed Application for Assessment Special Consideration Form to your Learning Facilitator.


Hire Experts to solve this assignment before your Deadline
Buy Today, Contact UsAre you trying to find someone who can help with my STA201 Business Statistics? Well! You're in the right place, our podium. Workingment provides Business Analytics Assignment Help. Our well-researched and talented professors can also provide you with odd assignments. Suppose you're judging whether to Write My Assignment with our professors. No doubt! Our team can help with your assignment. We also provide Free Sample assignments for your guidance. Get in touch right now!
Hire Assignment Helper Today!
Let's Book Your Work with Our Expert and Get High-Quality Content
