| Category | Assignment | Subject | Education |
|---|---|---|---|
| University | The University of New South Wales (UNSW Sydney) | Module Title | MMAN3200 Linear Systems and Control |
| Academic Year | 2025 |
|---|
| Term: | 2 |
| Assignment | Lab 1: Activity Sheet |
Much of the content of this document has been derived from the lab documents provided by Quanser Inc., and also some documentation provided by Dr Mohammad Deghat from the MTRN3210 course. Their contributions are gratefully acknowledged.
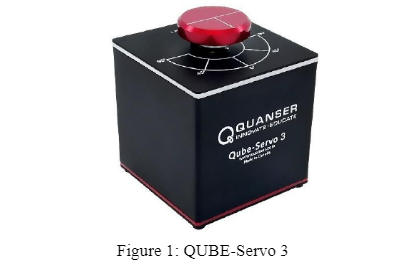
In this lab, you will work in pairs to study the behaviour of the Quanser QUBE-Servo 3 test rig, shown in Figure 1. It is recommended that you take notes during the lab, and you will be required to save some data, so please plan for this in advance.
The lab has the following objectives:
The activities for the lab will be broken into two main sections: 1) parameter identification activities, and 2) stability assessment activities, as outlined below.
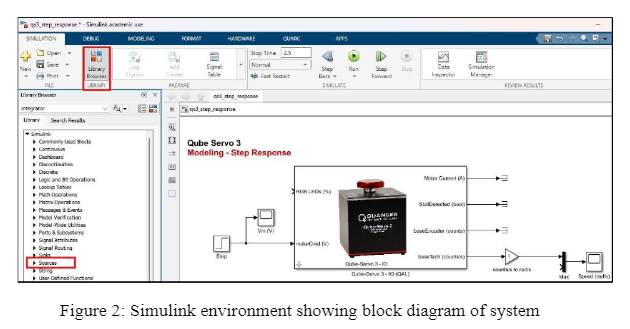
For this set of activities, you will use a provided Simulink file as a base to design a model that applies a step of 5 V to the motor at time 𝑡 = 1 s and reads the disc rotational velocity using the inbuilt digital tachometer/encoder.
1. Ensure the QUBE is connected to the PC via USB and that the unit is switched on (switch on the back of the unit).
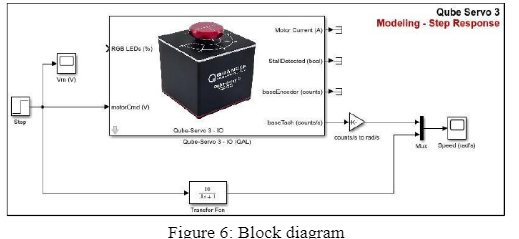
2. Open MATLAB and open the qs3_step_response.xls file. Then open the Simulink Library Browser by clicking on the icon highlighted in Figure 2. Click-and-drag the ‘Step’ block from Simulink | Source to the main window and connect the Step block as shown in Figure 2.
3. Double-click on the Step block to open its options. Change the Step time to 1 and the Final value to 5.
4. Double-click on the ‘counts/s to rad/s’ block and change the gain to 2∗pi/2048 ≈ 0.003068. This block will convert the units of the encoder so that disc rotational velocity is displayed in rad/s.
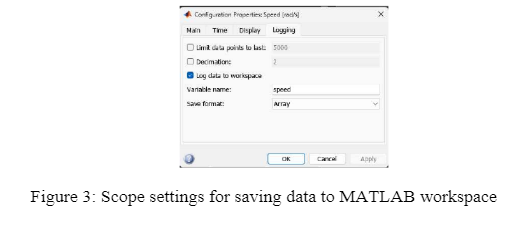
5. Confirm that the scopes are configured to save the output information in your MATLAB workspace. Open the scopes and click the configuration/gear icon on the top left side of the window, right below File. The logging tab in the window should look like Figure 3 for the speed scope. The variable name should be voltage for the Voltage scope.
Do You Need MMAN3200 Assignment of This Question
Order Non Plagiarized Assignment6. You are now ready to run the system. Navigate to the Hardware tab and click the Monitor & Tune button. After a few moments to compile the program, the controller should apply a 5 V step to the servo. The scope for the input voltage and the QUBE’s response should look like the plots in Figure 4.
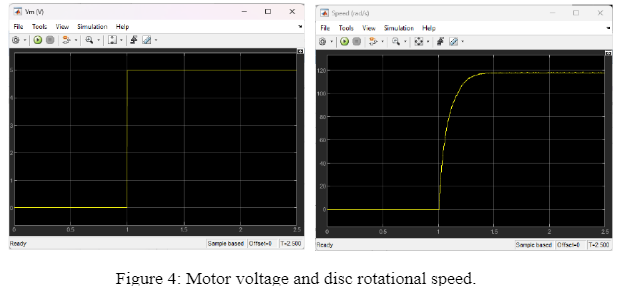
7. Measure K (the steady-state gain) and τ (the time constant) of the response. Refer to the Background Information Sheet if needed. Since you are working in pairs, you may wish to do the measurements and calculations independently and compare with one another, to minimise the chances of error.
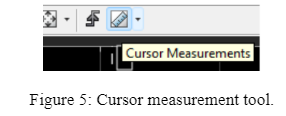
Hint: Use the Cursor Measurements tool in the Simulink Scope to take measurements directly from the response plots (see Figure 5). You may need to use the Zoom X and Scale X & Y Axes Limits buttons to be able to accurately measure K and τ.
8. To verify if your measured model parameters K and τ are correct, modify the Simulink diagram to connect the Transfer Fcn block as shown in Figure 6. Modify the transfer function to be the first order model you obtained for the QUBE (in the form 𝐾/(𝜏𝑠 + 1)).
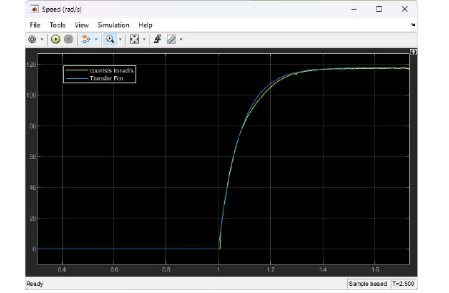
9. Now run your system as in Step 6. Look at the Speed Scope output to compare your ‘estimated parameter’ model with the real output. The speed plot should look like Figure 7 but across the 2.5 seconds for which the model ran. Discuss the results with your partner. If the two curves do not look as similar as hoped, you may wish to iterate a couple of times to see if an improved fit can be obtained. Once you are happy with the results, show them to the lab demonstrator. Take note of the obtained K and τ values for the Lab Report assessment. Now navigate to the MATLAB workspace and save the ‘speed’ and ‘voltage’ variables to a MAT file, so that you can provide a response plot in your Lab Report assessment. The MATLAB variables are arranged as matrices with column vectors, with the first column being time and the second column the given variable.
Hire Experts to solve MMAN3200 Assignment before your Deadline
Pay & Buy Non Plagiarized AssignmentFor this set of activities, you will use a provided Simulink file to apply different inputs to assess the stability of the QUBE system, this time analysing the motor rotational position as an output alongside the rotational velocity.
1. Open the qs3_stability.xls file. A Step block should be connected as the input, but if it is not, follow Step 2 from Part 1 to connect it. Double click on the step block and set it to apply a 5 V step to the motor at 𝑡 = 1 s. Set the ‘Stop Time’ to 5 s in the ‘Run on Hardware’ section of the ‘Hardware’ tab.
2. You are now ready to run the system. Click the Monitor & Tune button in the Hardware tab. The scopes for the input voltage and the QUBE’s response should look like the plots in Figure 8. It is recommended that you navigate to the MATLAB workspace at this point and save the ‘speed’, ‘position’ and ‘voltage’ variables to a MAT file.
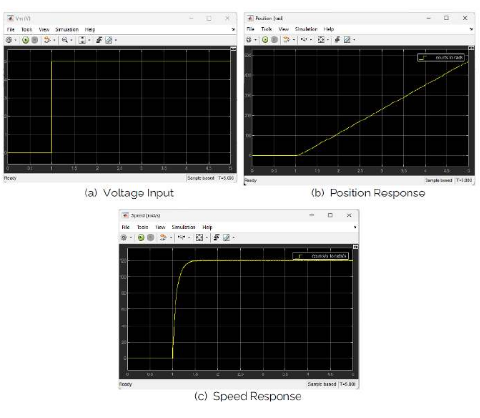
Carefully consider the response plots and, if needed, review the BIBO stability principle in the Background Information Sheet.
3. Based on the speed response and the BIBO principle, what is the stability of the system?
4. Based on the position response and the BIBO principle, what is the stability of the system?
5. Is there an input where the position response is stable? If so, then modify your Simulink diagram to include your input and test it. Hint: try a sinusoidal input and compare the position response with the step response observed earlier. To insert a sinusoidal input, delete the Step block on the left and navigate to Simulink | Source, then click-and-drag the ‘Sine Wave’ block to the main window and connect it as with the Step block previously. Double click the Sine Wave block and set the amplitude to 5V, the frequency to π rad/sec and ensure the model again runs for 5 seconds. Click the Monitor & Tune button to run the system and assess the results again using the BIBO stability principle. It is recommended that you navigate to the MATLAB workspace now and save the ‘speed’, ‘position’ and ‘voltage’ variables to a MAT file.
6. If you still have time remaining, you may wish to experiment with different types of inputs. Otherwise, you can now close your model and power OFF the QUBE.
Achieve Higher Grades MMAN3200 Assignment & Raise Your Grades
Order Non Plagiarized AssignmentIf you are worried about the MMAN3200 Linear Systems and Control Assignment? No need to worry anymore! Our experts provide Assignment Help Australia that has been designed for the students. You will get expert guidance and help on assignments that will strengthen your concepts. We also provide you with free assignment samples that will help you understand. And the best part? All the content is 100% original, written by PhD expert writers, and well-researched, so that you get the best quality. AsSo don’t delay now; boost your grades with our help!
Hire Assignment Helper Today!
Let's Book Your Work with Our Expert and Get High-Quality Content
