| Category |
Assignment |
Subject |
Accounting |
| University |
|
Module Title |
Unit 5 Accounting Principles |
| Word Count |
200 words |
| Academic Year |
2024-25 |
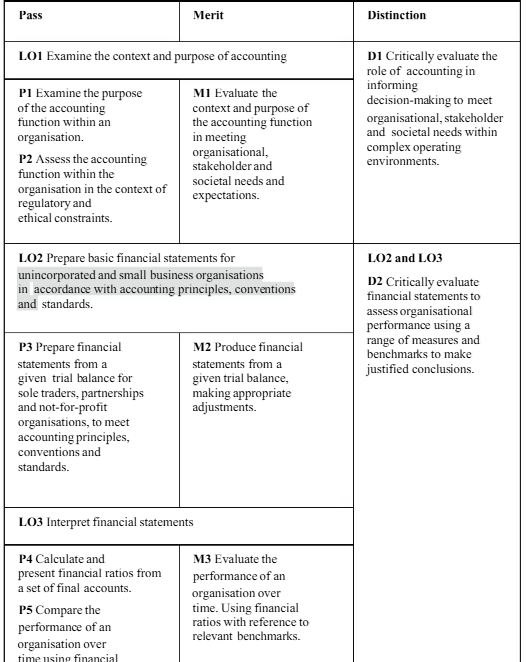
Unit Learning Outcomes
LO3: Interpret financial statements July 29, 2025 August 31, 2025
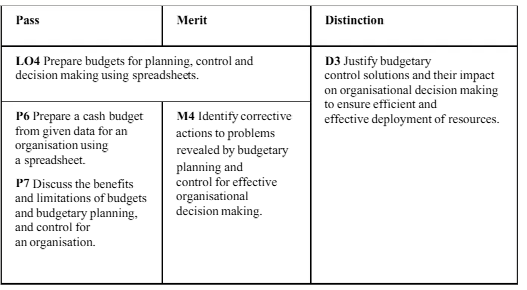
LO4: Prepare budgets for planning, control and decision making using spreadsheets
Transferable Skills and Competencies Developed
- Critical Thinking: Evaluate accounting practices, considering ethical and regulatory implications for informed decisions.
- Communication Skills: Effectively present financial information in written form (reports, statements), ensuring clarity.
- Financial Literacy: Understand core accounting concepts and accurately interpret financial information.
- Ethical Awareness: Recognise and address ethical issues in accounting for responsible financial management practices.
- Regulatory Compliance: Comprehend regulatory financial requirements for maintaining lawful practices in accounting.
- Technology Proficiency: Use accounting software to increase efficiency and accuracy of financial tasks.
General Guidelines:
1. Plagiarism, formatting issues, and significant grammatical or structural mistakes will result in deductions (must not be greater than 10%)
2. It's expected that students follow a standard citation style (e.g., APA, Harvard) for proper referencing.
Assignment Activity and Guidance:
Instruction:
Please use this link to access Masan Group's annual reports for the three years (2022, 2023, and 2024). Using information from the annual report and other reliable sources to address the following questions.
Task 1: Company Overview
- Within 200 words, provide an overview of Masan Group, including the principal activities of the Group and the accounting period.
Task 2: Understanding and evaluating financial statements and annual reports
- From the given Annual Reports of the company, calculate and make a table for comparison of figures among three years (2022, 2023, and 2024): Gross Margin, Asset Turnover, ROA, ROE, Quick Ratio, Current Ratio, Debts to Assets Ratio, Inventory Turnover, and Average Inventory Days. Make some interpretations of these figures. Provide relevant recommendations for the company.
- Analyse the 'profitability" and "efficiency" of the company for the relevant years.
- If you were contemplating an investment in this company, identify other non-financial information that would assist your investment decision and explain why this information is essential to investors.
- Who were the independent auditors for Masan Group in their 2024 annual report, and what opinion did they provide on the financial statements? As a shareholder of Masan Group, how important is the auditor's report to you?
Task 3: Budget Preparation
OPTICA manufacturing company sells lenses for $45 each and estimates sales of 15,000 units in January and 18,000 in February. Each lens consists of 2 pounds of silicon costing $2.50 per pound, 3 oz of solution costing $3 per ounce, and 30 minutes of direct labour at a labour rate of $18 per hour. Desired inventory levels are:
- Prepare a sales budget, production budget, direct materials budget for silicon and solution, and a direct labor budget.
- Provide interpretations and relevant recommendations.
Additional Comments:
- Deductions will be made for major issues with citations, references, plagiarism, or formatting.
- Use Times New Roman font, in size 12.
Learning Outcomes:
LO3: Interpret financial statements
Importance and purpose of analysing financial statements:
- To communicate financial positions and intentions with a range of stakeholders. Financial forecasting to predict future revenues, expenses and cash flow. Evaluating performance and effectiveness for making decisions and formulating plans.
Ratio analysis:
- Calculate profitability, liquidity, efficiency and investment ratios from given data. Using calculated ratios to evaluate organisational performance.
- Apply and critique relevant benchmarks, including time series, competitors, sector and internal.
Limitations of ratio analysis:
- Ratio analysis as one means of measuring and evaluating the performance of an organisation, e.g. use of qualitative/non-financial measures.
- Limitations of using ratios as a performance measurement tool.
- The interrelationships between ratios.
Importance and purpose of analysis of financial statements:
- The interpretation and analysis of financial statements in the business environment.
- Interpreting the relationship between the elements of the financial statements, profitability, liquidity, efficient use of resources and financial position.
- Interpreting financial statements for meeting key performance indicators (KPIs) and sustainable performance.
- Application of financial statements in different business contexts and the value of presenting to the end user of the financial statements.
LO4 Prepare budgets for planning, control and decision making using spreadsheets
Nature and purpose of budgeting:
- Budgets as a key management accounting tool.
- Definitions and reasons organisations use budgets.
- Stages in the budgeting process: master and functional budgets.
- Corrective action to inform resource allocation and decision making.
Budget preparation and budgetary control:
- Importance, role and limitations of budgets in controlling activity.
- Budget-setting cycle: limiting or key factors; functional budgets, cash budgets, the preparation of sales budgets, debtors' budgets, creditors' budgets, production cost, raw materials and finished goods budgets.
- The principal budget factors and budget types, including fixed, flexible, zero-based, incremental, rolling, activity-based, and value proposition.
Variance analysis.
- The steps for the preparation of a cash budget.
Producing a spreadsheet:
- The numerical and other information requirements for a spreadsheet, and how it should be structured to meet user needs.
- Using a spreadsheet and techniques to enter, edit and organise numerical and other data.
- How to format spreadsheet cells, rows, columns and worksheets effectively using appropriate tools and techniques
- Use of formulas and filters to enter, edit and present numerical data.
- Visual representation of data and data analysis using pie charts, bar charts and graphs.
- Inserting spreadsheet data into Word® documents.
Learning Outcomes and Assessment Criteria


