| Category | Assignment | Subject | Science |
|---|---|---|---|
| University | Swinburne University of Technology | Module Title | STA20009 Epidemiology |
In this assignment, you will tackle scenarios relevant to the field of Epidemiology, using some real and some fictitious data.
It is highly recommended that you attempt the assignment questions every week (after completing each module related to this assignment task) so that the information is still fresh and does not become overwhelming, which can happen if you leave it all to the last minute. There are four topics included in this assessment task.
Recommend a timeline for assignment tasks:
To successfully complete these 4 tasks, you should make an effort to watch all the lectures and attend all the tutorials, as well as complete the accompanying activities. If you have any queries, require an extension, or have any other related issues, please contact the unit convenor, Jahar Bhowmik (jbhowmik@swin.edu.au), immediately.
The following data come from a famous study of environmental factors (including many dietary variables) and cancer. Cancer incidence data from 23 countries* were taken from the International Union Against Cancer from 1966 and 1970, and incidence rates for ages 35-64 years were used with the world population as the standard. The dietary data were derived from a variety of sources, including the Food and Agriculture Organisation and the Statistical Office of United Nations Statistical Office, 1960 and 1970. Some results of the study are presented in Figure 1. [6 marks]
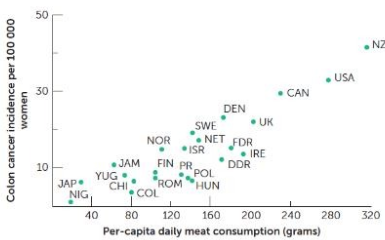
Figure 1: Correlation between incidence of colon cancer in women and per-capita daily meat consumption in 23 countries
*NIG = Nigeria, CAN = Canada, CHI = Chile, COL = Columbia, JAM = Jamaica, PR = Puerto Rico, ISR = Israel, DDR = German Democratic Republic, FDR = Federal German Republic, DEN = Denmark, FIN = Finland, HUN = Hungary, IRE = Ireland, JAP = Japan, NET = Netherlands, NZ = New Zealand, NOR = Norway, POL = Poland, ROM = Romania, SWE = Sweden, UK = United Kingdom, USA = United States of America, YUG = Yugoslavia
Source: Armstrong, B. and Doll, R. (1975), with permission from John Wiley and Sons, Inc.
Do You Need STA20009 Assignment of This Question
Order Non Plagiarized Assignment2. Mortality for Male and Female Australiand in 2021 [16 marks]
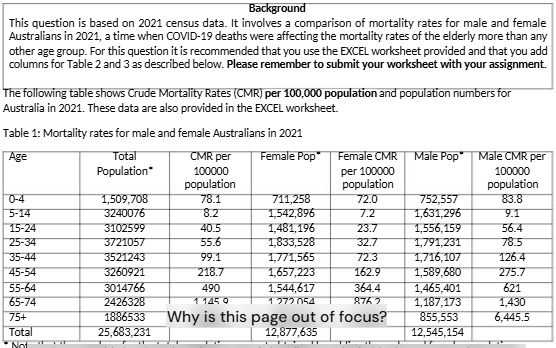
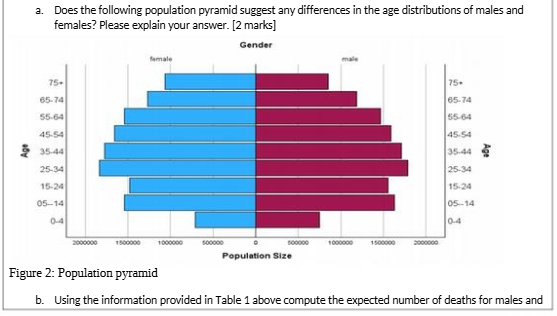
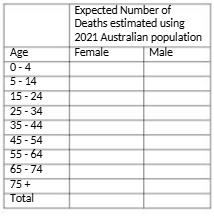
females in each age bracket using the total Australian population for 2021 as the reference population. (e.g. Expected Number of deaths for males = Australian population * Male CMR). Include these numbers in Table 2 below. [1 mark]
c. Compute the total number of expected deaths for males and females (just add them up) and include these numbers in Table 2, bottom row. [1 mark]
Table 2: Computation of age-adjusted mortality rates using the direct method.
Compute age-adjusted mortality rates for males and females by dividing the total expected number of deaths by the total number of Australians and then multiplying by 100,000. What do these results suggest? [3 marks]
In Table 3 use the information provided in Table 1 to estimate the observed number of deaths for males and females in each age bracket (CMR*population). Include these numbers in Table 3 below. [1 mark]
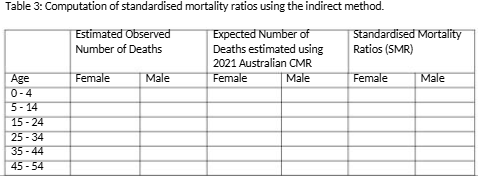
In Table 3we use the Australian population CMRs to compute the expected number of deaths for males and females. (e.g. expected deaths for females = Australian population CMR* female population). [1 mark]
Buy Answer to This Assignment & Raise Your Grades
Buy Today, Contact UsCompute the total numbers of observed and expected deaths for males and females (just add them up) and include these numbers in Table 3, bottom row. [1 mark]
In Table 3, we then compute standardised mortality ratios by dividing the observed number of deaths by the expected number of deaths. [1 mark]
Table 3: Computation of standardised mortality ratios using the indirect method
Using information from Table 3, calculate the age-adjusted risk of death for males, noting the percentage difference compared to the total Australian population in 2021. Was it higher or lower? [1 mark]
Using information from Table 3, calculate the age-adjusted risk of death for females, noting the percentage difference compared to the total Australian population in 2021. Was it higher or lower? [1 mark]
Were overall standardised mortality ratios higher for men or women in 2021? Were there any age groups where this difference was relatively small? Can you explain why this might have been the case? [3 marks]
Imagine you have just read a report from a case-control study in which the response rate among cases was 90%, but among controls it was only 50%. [4 marks]
The authors report an OR (OR) of 2.0 for the association between smoking and disease. How would you interpret this? [2 marks]
If the reported OR had been 0.8, would you have been more or less worried about potential bias, and why? [2 marks]
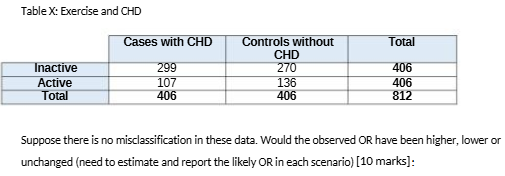
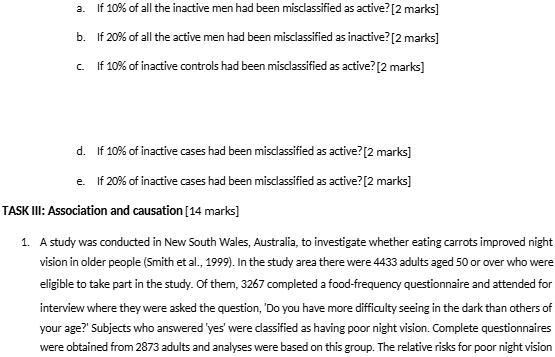
2. A case-control study was conducted to evaluate the relationship between physical activity and coronary heart disease (CHD) in men. A total of 406 men newly diagnosed with CHD were included, together with 406 men of similar ages who did not have CHD. Calculate the odds ratio (OR) for the risk of CHD in active men compared to inactive men and interpret the results based on the information provided in Table X below.
Table X: Exercise and CHD
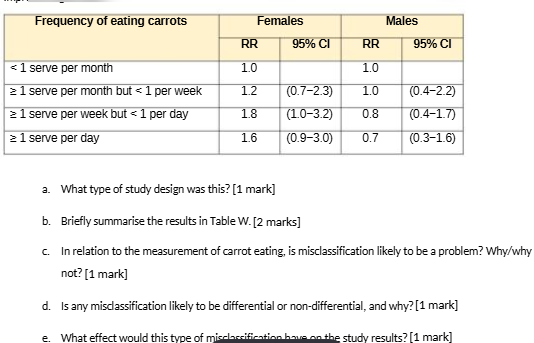
What is the major problem with this type of study when it comes to establishing causality? [1 mark]
Do these data suggest that eating carrots causes night blindness in women, or can you suggest an alternative explanation for this association? [1 mark]
What type of study would be best to answer the question of whether eating high levels of carrots (or of vitamin A / β-carotene - the active component of carrots) could prevent loss of night vision and why? [2 marks]
2.In a trial by the Medical Research Council of the United Kingdom to investigate the use of the antibiotic streptomycin for treatment of pulmonary tuberculosis (MRC, 1948), cases were included from four London hospitals and three hospitals in Wales, Scotland and Leeds. By September 1947, 109 patients had been recruited but two died within the preliminary observation week and were excluded from the analysis. Of the remaining 107 patients, 55 were randomised to the streptomycin group and 52 to the control group. Outcomes were assessed after six months, and, in addition to the usual hospital records, clinical observations were entered on standard record forms designed particularly for this trial (Table Z). Radiological assessments were performed by independent specialists who were blinded to the patient's study group, and a consensus judgement was reached. [4 marks]
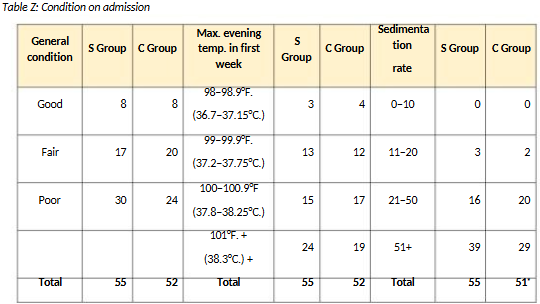
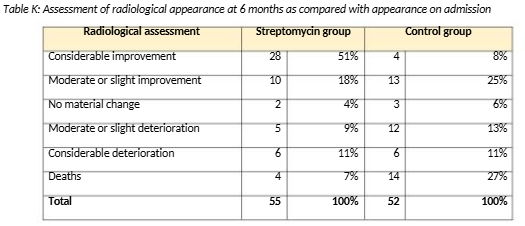
It was identified that those treated with streptomycin were 6.6 times as likely to show 'considerable improvement' compared to the control group (RR = 6.6) and that the attributable risk (AR) was 43%. Similarly, the treated group had only about 25% of the risk of mortality compared to the control group (RR = 0.27) with an AR of 20%.
What conclusions can we draw regarding the validity of these data and whether streptomycin is an effective treatment for TB (i.e. the relationship is causal)? Explain. [4 marks]
Struggling with assignments and feeling stressed?
Order Non-Plagiarised Assignment(Source: The following text and Table L are loosely based on data from Pitt and Balanda, 1991.)
In some countries, drowning is a major cause of disability and death in children. Imagine that the number of domestic swimming pools in your community is increasing, so you want to assess the safety of different types of pools and the effects of pool fencing. Information about drowning incidents is available from a database at the local hospital. All emergency paediatric cases in the area attend this hospital, and admission for observation is standard practice in the management of near-drowned children. Information about the number of households with pools is available from a recent survey, and population data for the region are available from the National Bureau of Statistics. The following information presented in Table L below is collected.

Stuck on your STA20009 Epidemiology? Don't worry! Our Epidemiology Assignment Help service is the best for you. If you need help with assignments, our expert PhD writers will provide you with original content. And yes, you will also get free assignment samples, which will give you a perfect idea of how to write a top-quality assignment. Don't worry about the deadline as we guarantee on-time delivery. Contact us now for high-quality and plagiarism-free work and boost your grades!
If you want to see the related solution of this brief then click here: Epidemiology
Hire Assignment Helper Today!
Let's Book Your Work with Our Expert and Get High-Quality Content
