| Category | Assignment | Subject | Engineering |
|---|---|---|---|
| University | Universiti Teknologi MARA (UiTM) | Module Title | MEC442 Fluid Mechanics II |
| Assessment Title | Assignment 2 |
|---|---|
| Academic Year | 2025 |
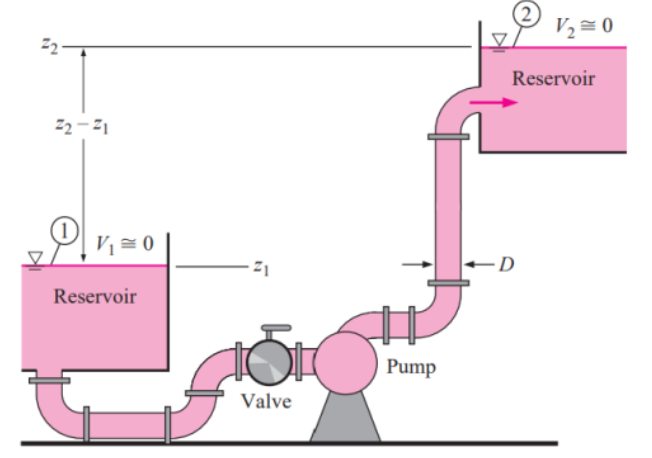
Your company has been assigned to evaluate two pumps, Pump A and Pump B, to be used in the piping system for transferring water from one large reservoir to another large reservoir that is at a higher elevation, as shown in Figure 1. The free surfaces of both reservoirs are exposed to atmospheric pressure.
The piping system specifications for the various parameters are provided in Table 1. Kindly use the data for H required or the system curve

Figure 1: Water pump with piping system
| PARAMETER | GROUP 1, GROUP 5, GROUP 9 |
GROUP 2, GROUP 6, GROUP 10 |
GROUP 3, GROUP 7, GROUP 11 |
GROUP 4, GROUP 8, GROUP 12 |
|---|---|---|---|---|
| Pipe Diameter, D (cm) | 2.03 | 2.03 | 2.03 | 2.03 |
| Roughness, ɛ (mm) | 0.25 | 0.25 | 0.25 | 0.25 |
| KL, inlet | 0.50 | 0.50 | 0.50 | 0.50 |
| KL, valve | 17.5 | 18 | 18.5 | 19 |
| KL, elbow | 0.92 | 0.90 | 0.88 | 0.86 |
| KL, exit | 1.05 | 1.05 | 1.05 | 1.05 |
| Total pipe length, L (m) | 176 | 180 | 185 | 190 |
| Elevation difference, z2-z1 (m) | 7 | 9 | 18 | 18 |
The performance curve (manufacturer data) for Pump A is given by an equation, while Pump B is given in tabulated form. Kindly use the data for H available for both pump A and pump B to be installed in the same piping system in Figure 1 and Table 1.

Using Microsoft Excel:
The pump performance curve (manufacturer data) is approximated by the expression:
Havailable = H0 – aQ2
H0 = 24.4
a = 0.0678 m/Lpm2
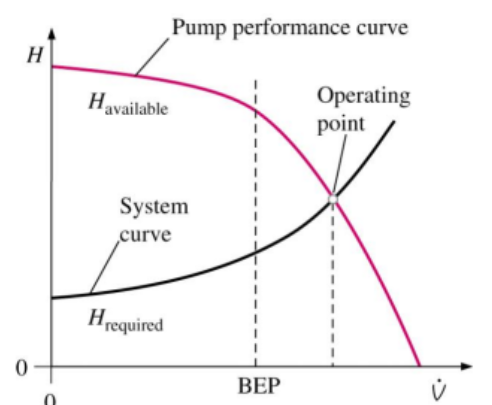
By varying Q from 0 Lpm to 20 Lpm, plot the Hrequired and Havailable on a clearly labelled graph and determine the operating head and flow rate.
[20 Marks]
The impeller has a uniform blade height of 50 mm, with the impeller inlet of 40 mm and outlet radius of 80 mm, respectively. The exit blade angle is 15°, and the tangential velocity component of the water entering the blade is zero. Assuming ideal flow conditions, fill in the pump performance curve (manufacturer data) as shown in Table 2 below.
Plot the Hrequired and Havailable versus Q from 0 Lpm to 30 Lpm. Clearly label the graph and indicate the operating point. State the equation represented by the curve.
Achieve Higher Grades with MEC442 Assignment Solutions
Order Non-Plagiarised Assignment| Q (LPM) | H (m) |
|---|---|
| 0 | |
| 5 | |
| 10 | |
| 15 | |
| 20 | |
| 25 | |
| 30 |
[20 Marks]
a) Series
b) Parallel
[10 Marks]
Show all work, calculations, and tabulated data.
[Note: Assume density of water is 1000 kg/m3 and viscosity is 1.002 × 10⁻³ kg/m⋅s]
Hire Experts to solve this assignment before your Deadline
Buy Today, Contact UsAre you trying to find someone who can help with my MEC442 Fluid Mechanics II? Well! You're in the right place, our podium. Workingment provides Engineering Assignment Help. Our well-researched and talented professors can also provide you with odd assignments. Suppose you're judging whether to Write My Assignment with our professors. No doubt! Our team can help with your assignment. We also provide Free Sample assignments for your guidance. Get in touch right now!
Hire Assignment Helper Today!
Let's Book Your Work with Our Expert and Get High-Quality Content
