| Category | Assignment | Subject | Economics |
|---|---|---|---|
| University | Singapore Institute of Management (SIM) | Module Title | ECON1064 Forecasting and Quantitative Analysis |
This project is designed to acquaint students with the application of forecasting techniques in business. This involves planning research, collecting data, carrying out appropriate tests, analysing data using regression analysis, and writing a business report based upon this empirical work.The assignment needs to be completed as a group of 3-4 students officially registered on Canvas. In exceptional circumstances, you may be allowed to complete it individually.Scope: maximum of 6 pages submitted (excluding cover sheet, Report title page, Report index (optional), References and appendix).Submission: Via Assignments folder in Canvas.
Only one submission is required per group. It is very important that you submit an assignment cover sheet with all the group members’ signatures/names at the time of submission. All students listed on the cover sheet will receive the same mark. If any dispute arises on your contribution to the group work, the cover sheet will be used as evidence of contribution.Marks: This project comprises 100 marks and will contribute 50% to your overall grade.
The stock market can have a profound economic impact on the economy and individual consumers. Financial analysts and economists are often interested in analysing and predicting stock price movements. One basic analysis is modelling the relationship between future and past (lagged) stock returns of individual companies. If an accurate prediction of future stock prices can be made based on past values, the monetary benefits can be substantial. You and your team members have recently been hired as financial analysts by Fortuna Capital Management. Your first assignment is to examine and forecast a company’s stock price movements.
Data: Your first task is to find and download the relevant data. To do this, you will need to go to the Investing.com - Stock Market Quotes & Financial News website and search for the required data. You may choose a US listed company as well if you wish. Here are a few pointers to help you collect your data:
Once you have selected your 1) company, 2) time interval/s, and 3) timeframe, you can download the data from the Investing.com - Stock Market Quotes & Financial News website. If you click on Markets>>Stocks it'll take you to the data webpage. You may also like to change the 'World Markets' option to, say, Singapore.
Do You Need help with ECON1064 Assessment 2 of This Question
Order Non Plagiarized AssignmentThe data you will download will have an extension csv.
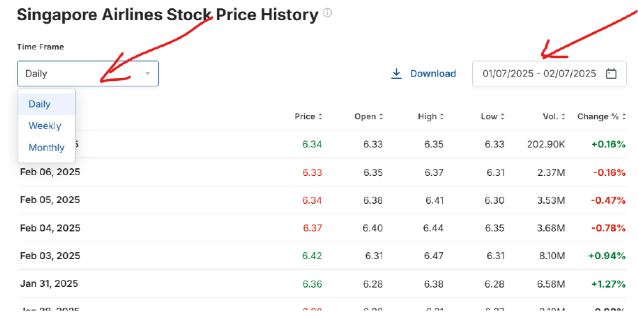
IMPORTANT: Say you choose to work with Singapore Airlines stock data. The data will be available under the ‘Historical data’ tab. By default, the most recent data is at the top. If you click on “Date”, it will reverse the order. Next, you will need to set the frequency to ‘daily’, ‘Weekly’, or ‘monthly’ for you chosen time period, and press Apply before you download your dataset (download button is just below ‘Apply’).
Your next task is to calculate daily/weekly/monthly returns for the Open prices (which is the opening price for the day/week/month and is also the last recorded price for the previous day/week/month). Recall that RETURN is calculated as:

Your next task is to calculate daily/weekly/monthly returns for the Open prices (which is the opening price for the day/week/month and is also the last recorded price for the previous day/week/month). Recall that RETURN is calculated as:

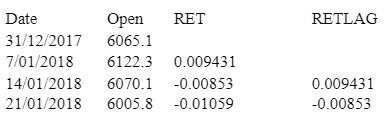
Classification: Trusted For example, if weekly time interval is used: Weekly Return = (Price in current week – Price in the previous week)/Price in the previous week. For example, given the below table, returns for the week starting 7/01/2018 is calculated by: (6122.3-6065.1)/ 6065.1=0.009431. You can name this variable as “RET”. You can also create lagged returns (RETLAG) as this is just the return from the previous week:

You can now begin your analysis. [Note: Questions need to be answered in the order they have been asked, with appropriate headings for different sections in the Report.]
Grading: 85 marks for statistical analysis and report + 15 marks for presentation
Buy Answer of ECON1064 Assessment 2 & Raise Your Grades
Request To By AnswerAre you stressed about your ECON1064 Forecasting and Quantitative Analysis Assignment? There's no need to worry! We are here to assist and provide zero-AI Economics Assignment Help of high quality with original content written by our PhD expert writers our expert team are provide online assignment help in singapore and we ensure your assignment will be completed on time Also, we have free assignment samples so you can get an idea of the quality. Our assignment help experts are available 24*7 whenever you need them.
Hire Assignment Helper Today!
Let's Book Your Work with Our Expert and Get High-Quality Content
