| Category | Coursework | Subject | Economics |
|---|---|---|---|
| University | Loughborough University (LU) | Module Title | ECB003 Introduction to Econometrics |
| Words count: | 1,500 words |
| Academic year: | 2025 |
For your assignment you will form a three-members group. Each group will have a variable(consumption, investment, imports, stock building or unemployment) and a country. The coursework task is to estimate and present the best possible equation (such as an unbiased,consistent and efficient model) you can obtain, which explains the behaviour of your variable using the data available in the database excel sheet on Learn.
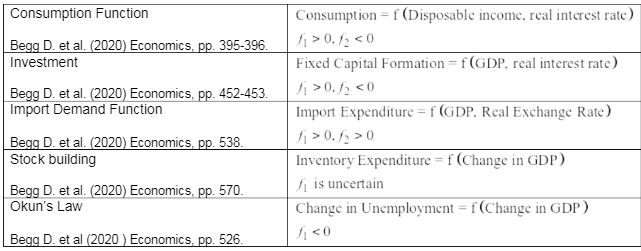
The table below gives some very general ideas about the type of functional relationship you should investigate.

In the table, underneath the functions we have indicated the usual signs for the response of the left-hand side variable to changes in the right-hand side variable(s) predicted by economic theory. Note that in the case of the inventory function (stock-building), the sign is ambiguous depending on whether the increase in GDP is anticipated or unanticipated .These functions are a starting point only. You need to make decisions about:
In many cases the logarithmic functional form is useful because it allows us to interpret the coefficients directly as elasticities. However, it is not always appropriate or even possible to estimate an equation in this form. For example, the logarithmic transformation cannot be applied to a data series which contains negative or zero values. You need to check your data to see if this is the case and only apply this transformation if it is possible.
The dynamic specification can also be tricky. Most time series equations will have some degree of serial correlation which can lead to misleading conclusions if not properly dealt with. You need to decide how to deal with this issue for your own particular model. Possible methods which we will cover in the lectures are differencing, the inclusion of lagged variables and the estimation of models with auto regressive errors. In many cases all of these methods are possible and will improve the final specification. It is up to you to decide which is most appropriate for your model. You should note that it may prove impossible to eliminate serial correlation entirely from your model. If this is the case, you need to acknowledge this in your discussion and recognise the implications for the interpretation of your estimated model.
Do you need ECB003 Assessment of This Question
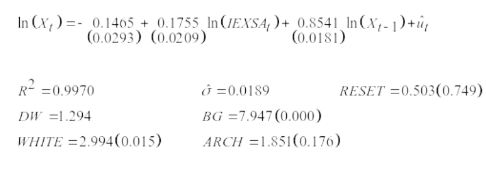
Order Non Plagiarized AssignmentUS Exports Equation Sample Period: 1979Q1 to 2005Q4 (108 observations

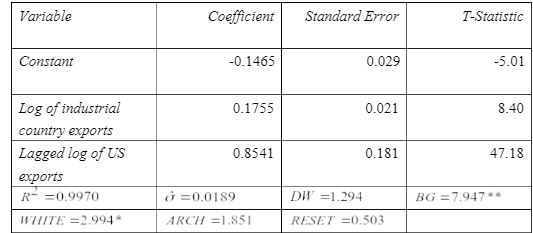
Numbers in parentheses below coefficients are standard errors. Numbers in parentheses next to test statistics are p-values.
Table 1: US Exports Equation Sample Period: 1979Q1 to 2005Q4 (108 observations)

indicates that the null is rejected at the 5% level, ** indicates that the null is rejected at the 1%level
Buy Answer of ECB003 Assignment & Raise Your Grades
Request To By AnswerStuck on your ECB003 Introduction to Econometrics Assignment? Don't worry! Our Econometrics Assignment Help service is the best for you. Whether you want help with assignments or Economics Assignment Help, our expert PhD writers will provide you with original content. And yes, you will also get free assignment samples which will give you a perfect idea of how to write a top-quality assignment. Don't worry about the deadline as we guarantee timely delivery. Contact us now for high-quality and plagiarism-free work and boost your grades!
Hire Assignment Helper Today!
Let's Book Your Work with Our Expert and Get High-Quality Content
