| Category | Assignment | Subject | Management |
|---|---|---|---|
| University | Manchester Metropolitan University (MMU) | Module Title | 6E7Z2127 Project Delivery 2: Managing Risks, Quality |
This is an assignment for students on Level-7 of the following courses:
Department of Engineering
It is an opportunity for you to deliver a successful improvement project and within this context to demonstrate how effective Risk, Quality and Benefits management is essential.
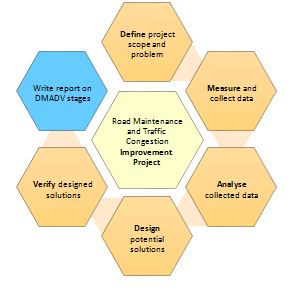
This assignment is an application of project risk management within the DMADV (Define-MeasureAnalyse-Design-Verify) framework of an improvement project. In this assignment, you will Define the problem; Measure and collect data; Analyse collected data; Design solution(s) to the problem; Verify designed solution(s) and finally report results leading to effective decisions. Many real-world problems have such a broad scope and/or so complicated that they resist a purely analytical solution. One technique for analysing these complex problems is simulation. This assignment relates to the application of the principles of Project Management (APM BOK 7th ed) such as risk identification and risk analysis (using Monte Carlo simulation); quality planning and control for process improvement; and application of lean Six-sigma tools and techniques for improvement projects.
In this coursework you will be working in pairs and your team will be allocated a busy road intersection in the city of Manchester as a case study.

Figure 1: Coursework workflow and stages of work
Plan a realistic schedule of work to complete this assignment on time and to a high standard.
This assignment is for 100% of your unit mark, and we expect you to spend up to 37.5 hours on it, in total.
The Assignment Support video will talk you through the workflow and help guide your plan for success.
Are You Looking for Answer of 6E7Z2127-CWK100 Assessment
Order Non Plagiarized AssignmentTraffic congestion costs people valuable time, fuel, and frustration every single day. At the same time, traffic congestion impacts the flow and producing pollution in certain areas. Congestion is a global problem that impacts all levels of society. The most common causes of traffic congestion are road incidents such as accidents and roadworks which often cause unexpected delays. Bad weather conditions also result in lower-traffic flow speeds, while poor traffic signal timing limits capacity on smaller inner roads. However, the largest increase in global traffic congestion is due to one main cause: there are too many vehicles for a road network with a limited capacity.
You can’t always avoid traffic but with accurate traffic predictions, you can make smarter choices that can save you money, time and increase overall road safety. Highly accurate traffic information also helps stakeholders by supporting the development of smart and sustainable mobility systems to reduce overall congestion levels.
Traffic prediction is the task of forecasting real-time traffic information based on actual vehicle data and historical traffic data, such as traffic flow, average traffic speed and traffic incidents.
In the city of Manchester, there are several busy road intersections where traffic congestion is a common issue and a routine sight. It costs people valuable time, fuel, and frustration every single day. To address this issue Manchester City Council has undertaken an improvement project to identify best day and time in the week to carry out essential road maintenance and repair work, also requiring a plan to divert the affected traffic (i.e., providing minimal impact on the traffic conditions in surrounding roads) whilst maintenance work continues at the busy road intersection.
ou are a Team Leader in one of these Road Maintenance and Traffic Congestion Improvement Projects. In your first assignment, you have been asked by the Manchester City Council to identify the problems/issues, collect, and analyse data, and come up with designed solution(s) for making improvements in road maintenance schedule and manage congestion caused by the diverted traffic at one busy road intersections. You must carry out this improvement project following the Six-Sigma framework of DMADV (Define-Measure-Analyse-Design-Verify).
Define: In the Define stage, you should form a project team; develop a project plan (identifying the Critical Path); identify specific or broad problems addressed in this project; define the project goal and scope; identify key stakeholders; provide stakeholder communication plan; define potential benefits for the stakeholders from this project; define Voice of the Customer, Voice of the Process, and Voice of the Business; identify Critical to Quality factors for this project; summarize customer requirements.
Measure: In the Measure stage, you should collect data to measure the current process or performance. Identify what data is available and from what source. Develop a plan to gather it. Gather the data and summarize it, telling a story to describe the problem.
Analyse: In the Analyse stage, you should analyse the current process performance and project/process risks from the collected data. Simulate (using Monte Carlo Simulation and Excel) the existing traffic flow scenarios using the collected data. You need to determine the Repair Duration (β) using Monte Carlo Simulation. You should begin to formulate and test hypotheses about the root cause(s) of the problem. You should also assess existing process design (e.g., value/non-value adding, bottle necks/disconnects, alternate paths, etc); identify ‘best practices’; refine customer requirements (if needed).
Design: In the Design stage, you should design and develop solution(s)/strategies to determine optimum day and time to schedule road maintenance work and best way to manage the diverted traffic so that it creates minimal congestion on the surrounding roads. The diversion route should enable the affected traffic flow to bypass the selected road intersection and minimize project risks. You should provide a roadmap or list of actions for implementation of your solution(s)/strategies and/or redesigned process/system.
Verify: In the Verify stage, you should verify your proposed designed solution(s)/strategies through simulation. You should make use of Control Charts (SPC) to verify that your designed diversion route(s) is(are) capable of bypassing the forecasted additional traffic flow within acceptable performance limits. If relevant, you may carry out a Failure Modes Effect Analysis to foresee how and which way your diversion plan may fail.
t is expected that you will use suitable Lean Six-Sigma tools such as Process Map, Control Charts (SPC), Ishikawa/Fish-Bone Diagram, Failure Modes Effect Analysis, Design of Experiments, QFD, etc. as and where needed at different stages of the DMADV framework.
Working in teams (of 2) you will be allocated a busy road intersection in the city of Manchester. Determine the optimum day and time to shut down a section of the main (busiest) approach road to the intersection for needed road maintenance that will take β hours from start to finish (Repair Duration). The measure of optimality being the lowest traffic count for a specific time of day in order to minimise disruption to traffic flow. Maintenance team working hours is 07:00 to 19:00 hrs Monday Friday.
Notes: Each team must engage in the road intersection selection process. Ultimately each team will be allocated a road intersection in the city of Manchester. No two teams will be allowed to select the same road intersection.
Determine the Repair Duration (β)
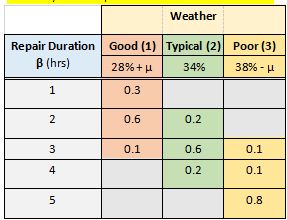
Historical records indicate the repair duration (β) is very dependent on three different types of weather conditions, dependant on your µ value. The repair duration (β) is an integer and varies discretely from 1 up to 5 hours as shown in Table 1.

Table 1: Repair Duration (β) Table
he µ value is an integer that forecasts the relative weather conditions. The µ value is the last digit of your student ID number (for the team use the average integer value – rounded up). For example, if your µ value is computed as 3, then the weather conditions would be Good (31%), Typical (34%) and Poor (35%). This would ultimately produce a higher probability of Poor weather leading to a 5hour repair time (β).
Using the data given in Table 1 with a suitable Monte Carlo simulation determine the Repair Duration (β). The developed Excel sheet with appropriate labels should be submitted as part of the cwk to support the decisions leading to day, time and duration of road closure.
Evaluate and simulate the Daily Traffic flow

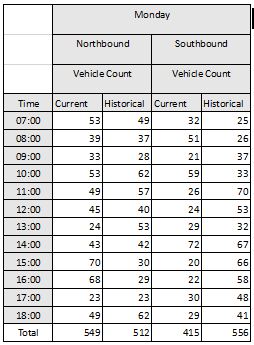
Table 2: Sample data for junction X

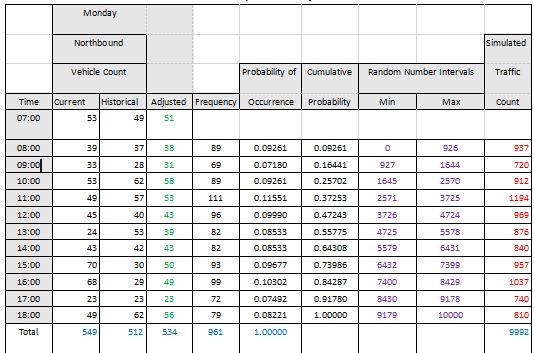
Table 3: Probability distribution for main approach road to junction X
(For example, when β=2 hrs)

Figure 2: Plots of simulated daily traffic flow
5. You are asked to analyse and interpret the expected traffic flows and make a recommendation as to which time-period on which day is the least intrusive time to close the road and conduct maintenance. The closure will affect both directions of the road leading to the intersection.
6. As a result of the closure a road traffic diversion needs to be devised and implemented. Investigate the optimum route and detail the impact on the selected diversion route using Monte Carlo Simulation.
Get the Solution of 6E7Z2127-CWK100 Assessment. Hire Experts to solve this assignment Before your Deadline
Order Non Plagiarized AssignmentThe coursework for this unit comprises TWO deliverables which are described below as Part 1 and Part 2. Part 1 of the coursework is a group task and accounts for 70% of the unit mark. Part 2 of the deliverable is an individual task and accounts for 30% of the unit mark. Both Parts must be submitted by each student.
Working in pairs, you are required to submit a report (of maximum 20 A4-size pages excluding appendices) and a simulation file (in Excel format) for Part 1. This report should include description of the tasks/activities, results obtained, critical evaluation of the results, and decisions made at each stage of the improvement project that follows the Six-Sigma framework of DMADV (DefineMeasure-Analyse-Design-Verify)
The Part 1 report should contain:
Individual Presentation (Report)
You are required to make an individual video presentation (report) of maximum 10 minutes duration on the road maintenance and traffic congestion improvement project that you have worked on; how you implemented the Six-Sigma framework of DMADV (Define-Measure-Analyse-Design-Verify) for your project; discuss details about how tools and techniques have been applied at different stages of the DMADV; your individual contribution to this project; and how the activities/tasks that you carried out in this project contribute to your professional development. As part of the presentation, you should provide a demonstration of your competency in using Monte-Carlo simulation in this project. The presentation must be recorded and submitted as a video file (e.g. mp4 format) in the submission area.
USD 1: Apply skills of critical analysis to real world situations within a defined range of contexts. (30%)
USD 5: Manage their professional development reflecting on progress and taking appropriate action. (30%)
USD 6: Find, evaluate, synthesise and use information from a variety of sources. (30%)
USD 7: Articulate an awareness of the social and community contexts within their disciplinary field. (10%)
Buy Answer of 6E7Z2127-CWK100 Assessment & Raise Your Grades
Request To By AnswerAre you struggling with 6E7Z2127 Project Delivery 2: Managing Risks, Quality assignments? Don’t stress! Our management assignment help service is here to guide you. We provide expert assistance, ensuring top-quality content that meets university standards. We provide all assignment services like Accounting assignment, Financial Statement Analysis Assignment Help. Need inspiration? Check out our free assignment samples to understand the perfect structure and approach. With our assignment writing Help, you get plagiarism-free, well-researched solutions on time.Contact us today and experience hassle-free academic success!
Hire Assignment Helper Today!
Let's Book Your Work with Our Expert and Get High-Quality Content
 } ] }
} ] }